consecutive matrix transformations are series of change of basis in activation space
- initial vector space with basis
{python} [1, 0], [0, 1], the yellow region indicates ReLU operation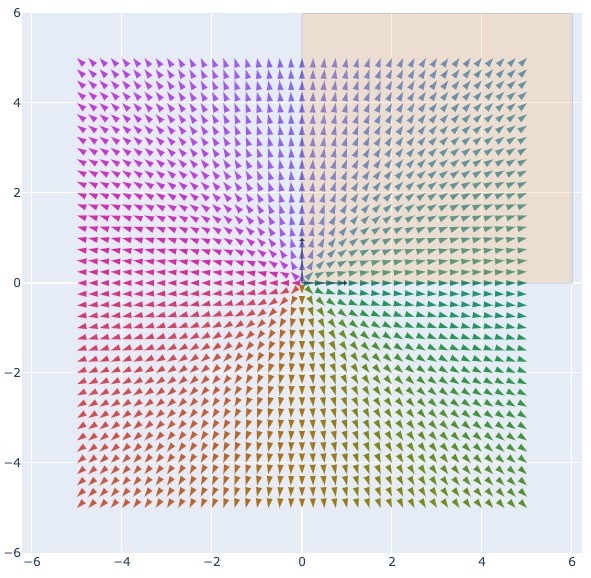
- the vector space after changed to basis
{python} [2, -1], [0, 2]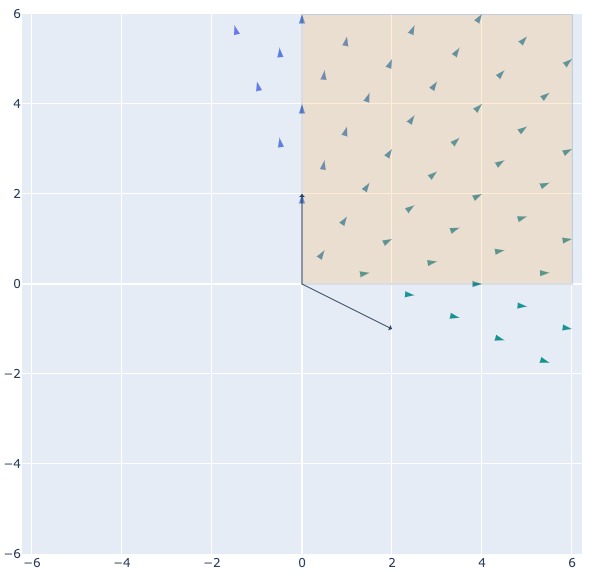
NNs are series of change of basis
-
multiplying with a matrix is changing the basis of the vectors (data) space
-
skip connection is combining the 1st orthant of the spaces spanned by multiple basis
-
applying ReLU is to discard everything but the 1st orthant/hyperoctant (all component is non-negative)
-
For a transformer layer:
- The skip connection is indeed maintain the geometry
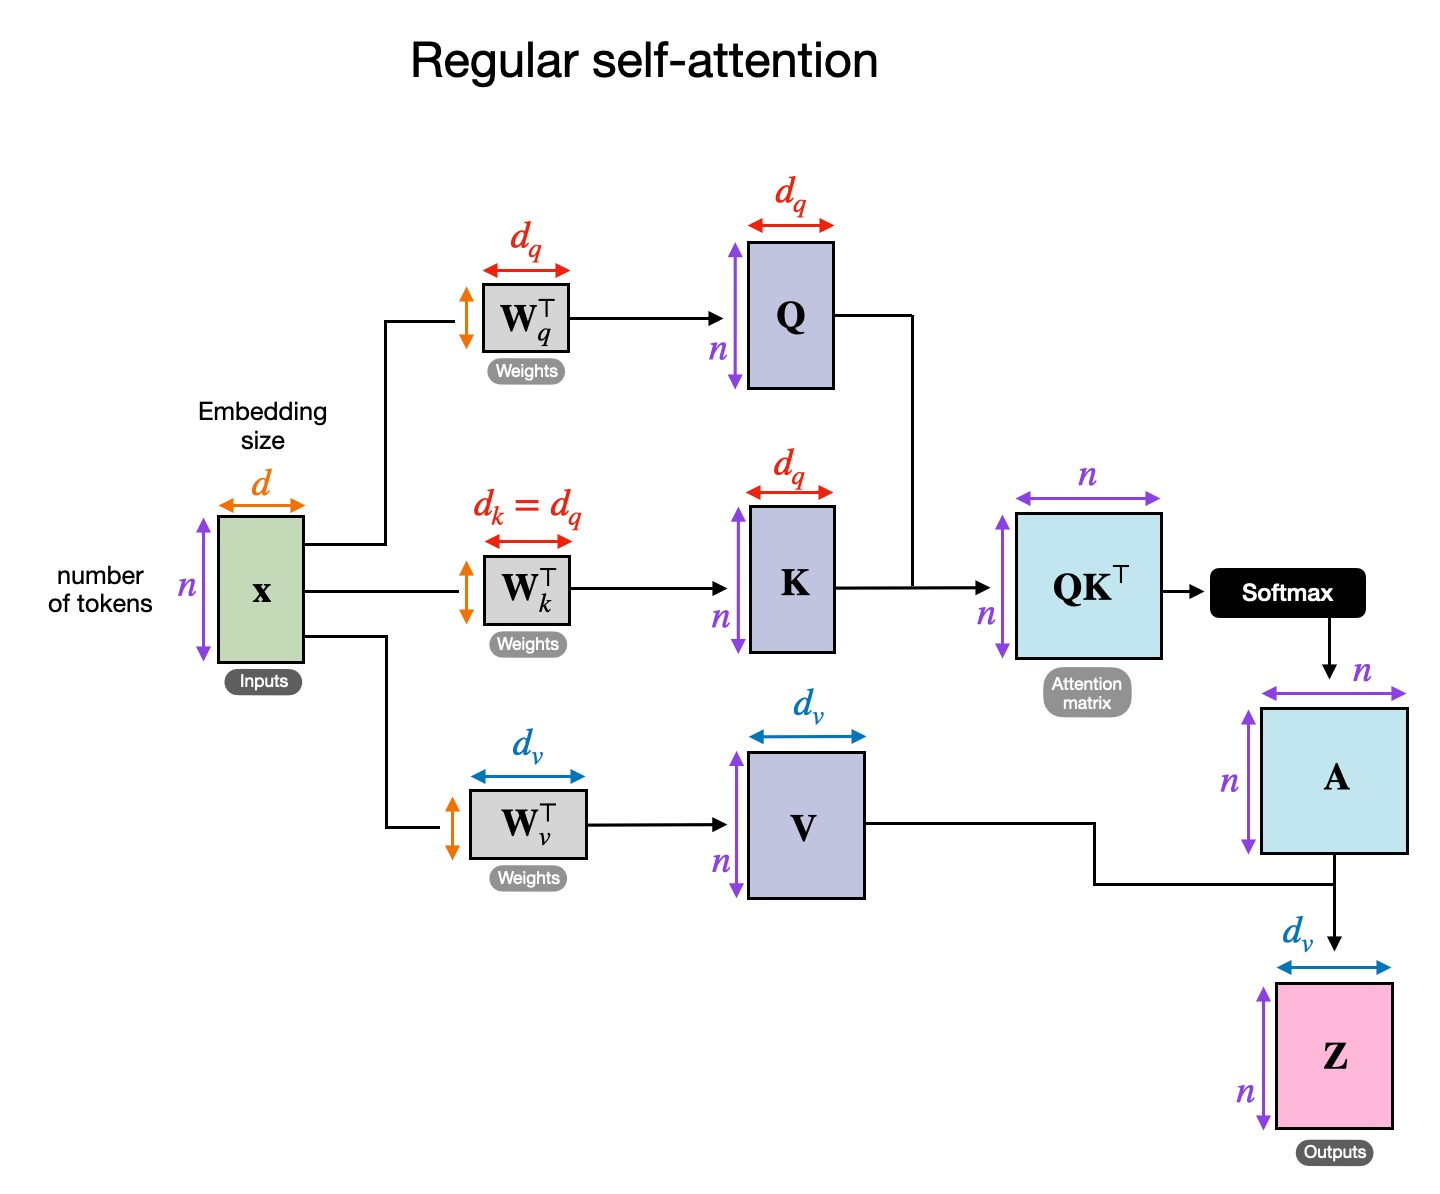
- In self-attention:
- When , the values is but with different basis vectors (by matrix transformation )
- Each row (token) in is a linear combination of each row (token) in (with the coefficients decided in )
- Hence have the same basis as
- Hence and are both in Euclidean space but with different basis
- Hence even with a softmax operation, transformer blocks are still a change of basis operation
- Each row (token) in is a linear combination of each row (token) in (with the coefficients decided in )
- When , the values is but with different basis vectors (by matrix transformation )
- So the attention layer learn a set of basis based on the tokens within the attention window
- By applying the skip connection, the output activations can be seen as combinations by 2 set of basis (with and without attention)
- as layer went deeper, the activations become the combinations of more and more basis vectors, each of which might represent different knowledge/behaviour hypothesis
transformer layers expand and “untangle” the activation space
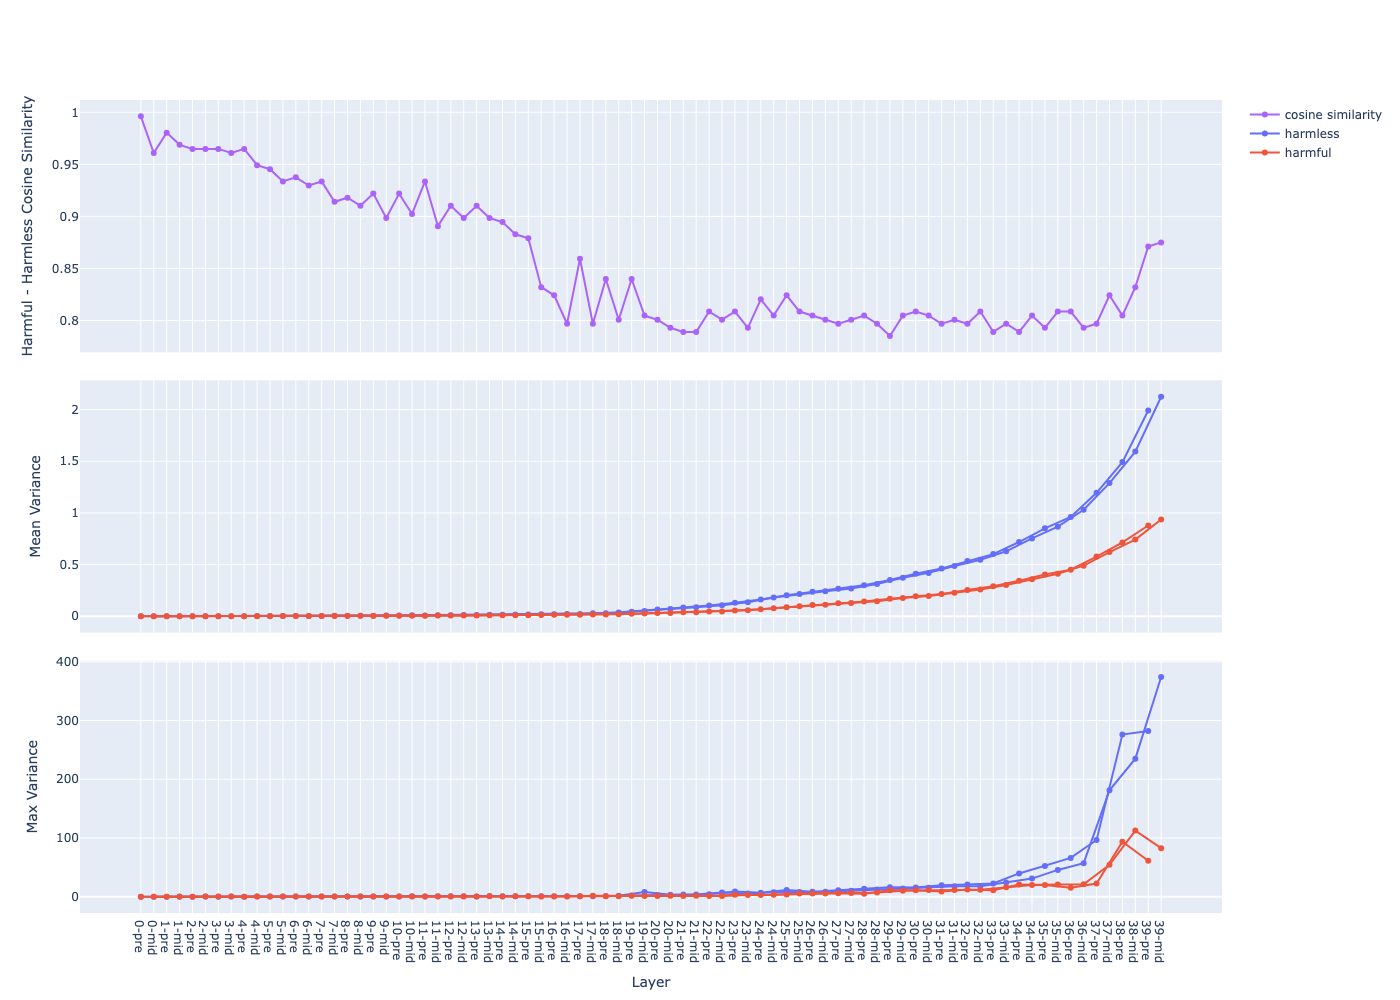
transformer layers expand and “untangle” the activation space
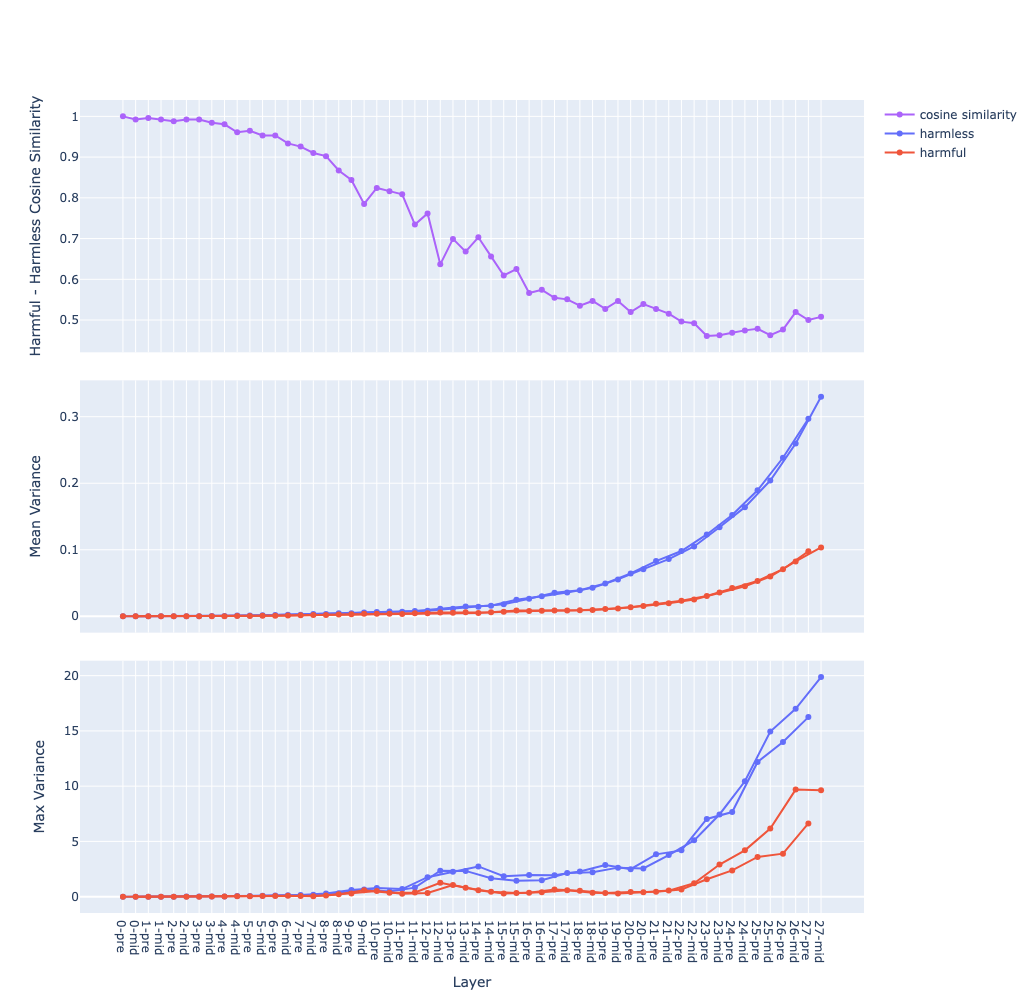
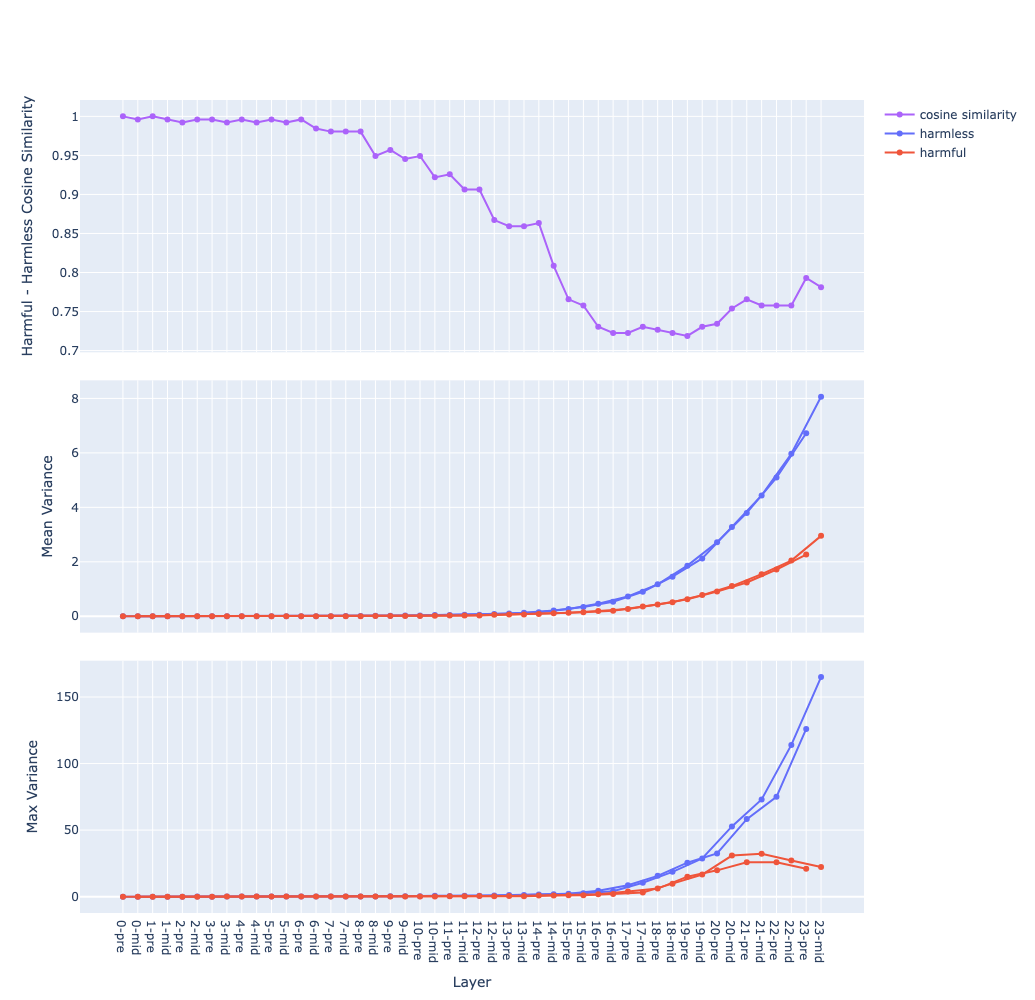
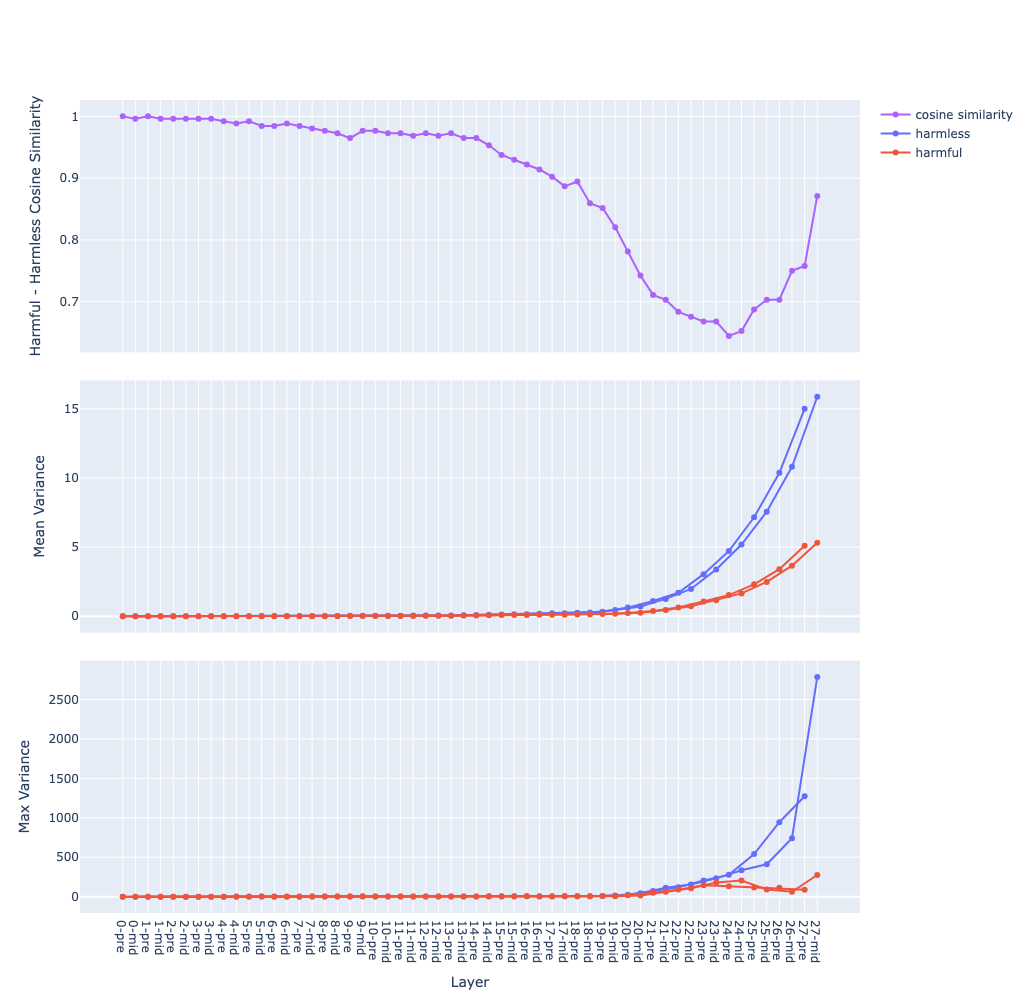
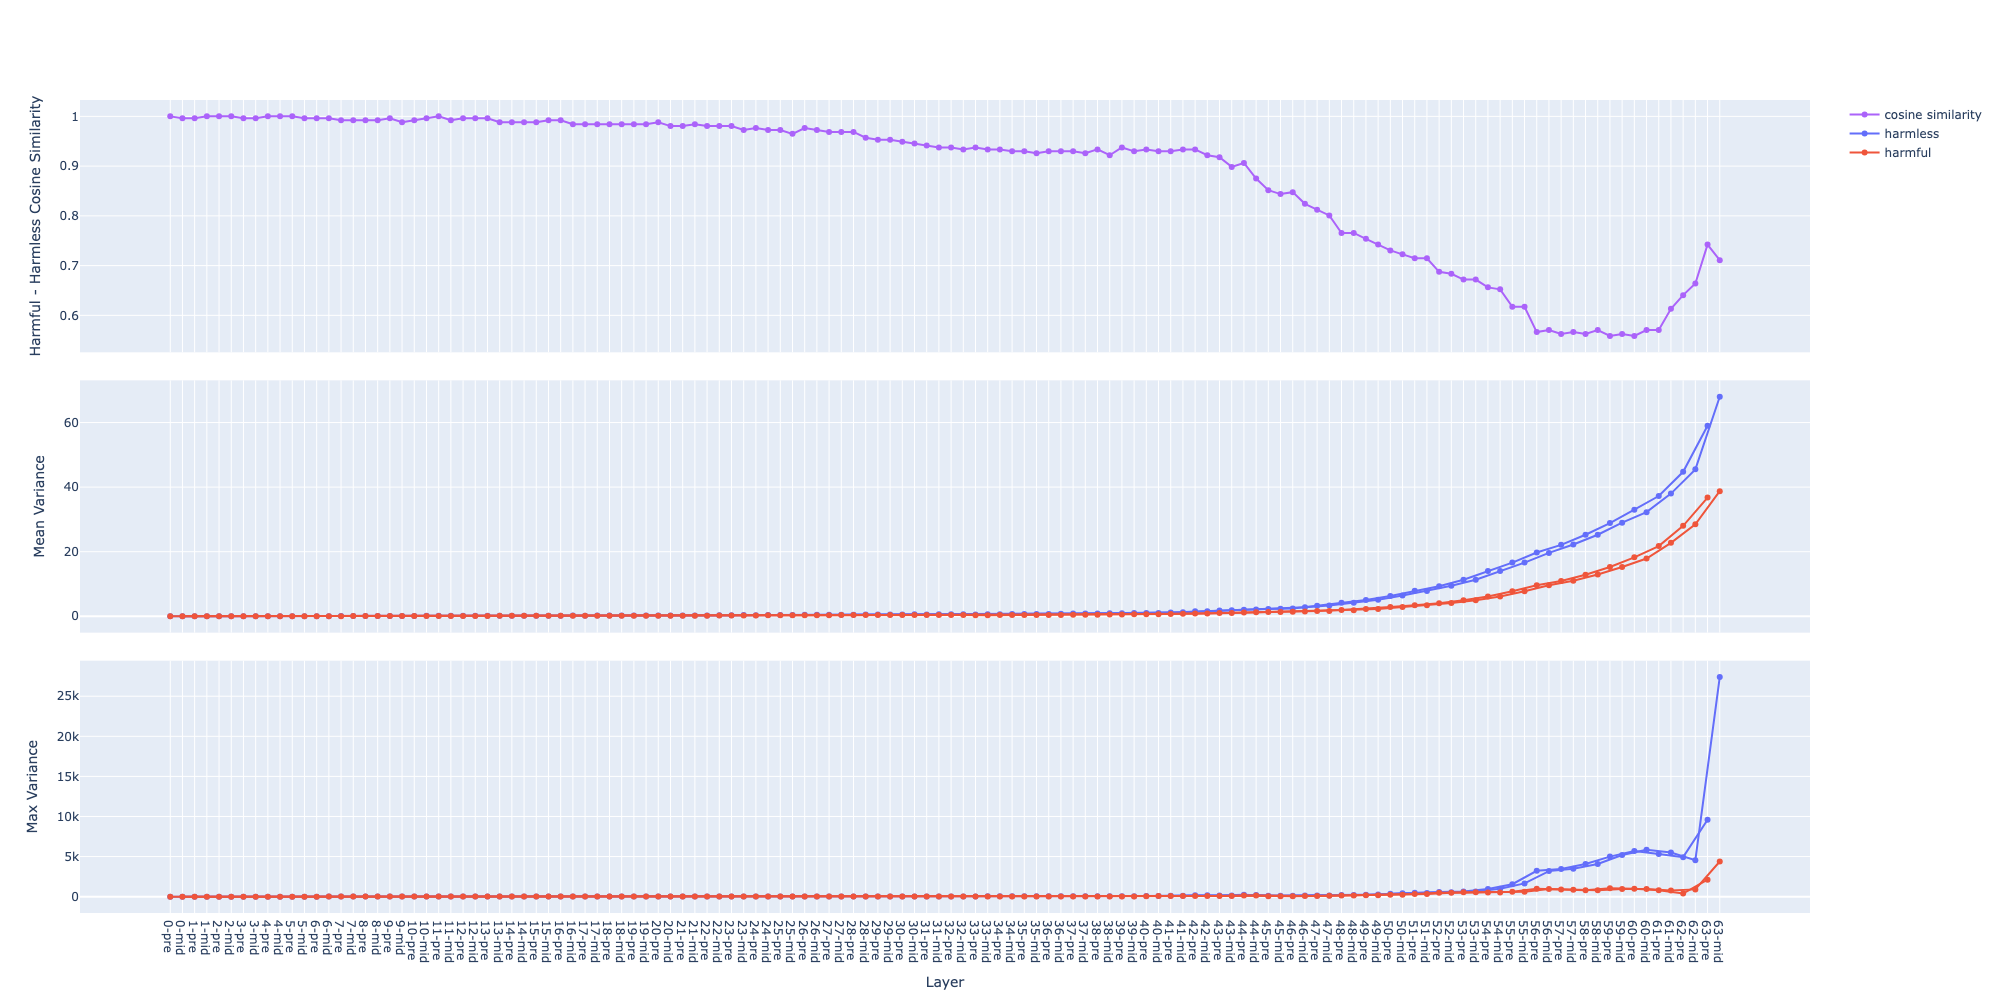
Steps to compute these graphs:
data sets: 2 contrastive data sets, in this case are
harmfulandharmlessfeed each data sets through the model and capture activations
- at each residual stream2
- at each layer
- at the last token → we get 2 matrices
P(positive) andN(negative) of sizesamples x layers x featuresthe top graph:
- compute the mean vector for each data sets:
X_mean = X.mean(dim=<sample>)→ we get 2 matricesP_meanandN_meanof sizelayers x features- compute the cosine similarity between the 2 vectors at each layer (e.g.
P_mean[l]andN_mean[l]), we get a vector of size1 x layerssimilarity_score = cosine_similarity(P_mean, N_mean, dim=<hidden>)the middle graph:
- compute the variance vector for each data sets:
X_var = X.var(dim=<sample>)→ we get 2 matricesP_varandN_varof sizelayers x features- then compute the mean along the feature dimension, we get 2 vectors of size
1 x layers:P_var_mean = P_var.mean(dim=<hidden>)N_var_mean = N_var.mean(dim=-<hidden>)- 2 curves of the same colour are for 2 residual streams, in this case are
preandmidthe bottom graph: same as the middle one but for max instead of mean
Observations, questions and hypotheses
The mean of variance (the middle graph) grows in a near-exponential trajectory from the first to last layer observation why ? question
- The growth of
pre(before attention) andmid(after attention) streams are separated observation why ? question- Hypothesis: hypothesis
- the model start with an initial state (the activation of the 1st layer) near the origin (due to input vector and the weights are usually between 0 and 1)
- each layer move the current state (the activation) through the activation space in some directions
- the directions are similar between layers, hence the state goes further and further along those directions
- suppose that the step size moved by each layer is within a similar range (due to layer norm), then total distance travelled (the norm of the activation vector) grows linearly
- hence the variance (distance squared) grows exponentially
- we can analyze this by checking for shared directions between the weights across layers experiment
Transformer layers expand and “untangle” the activation space the deeper we go hypothesis
- different samples would be aligned in different directions, hence they move further away
Setting high temperature (e.g. 1.0) reintroduces refusal
- try extracting the direction from activations from multiple generation with high temperature experiment
- This might increase the quality of the extracted feature direction
Visualization on several models of different sizes and families
Link to original
Llama 3.2 3B
Qwen 1 8B
Qwen 2.5 7B
Qwen 2.5 32B
Mistral-Nemo-Instruct-2407 (12B)
